Monitoring

Before you launch your search to production it is crucial to set up a monitoring to get notified when your search is in a critical status.
There are a lot conditions that can cause a critical status. Here are some common examples:
- the search is not a available
- the response time of the search is slow
- the number of documents is to low, because of indexing errors
- the last update of the index is out of date, because of problems with the feeding
The QSC provides an easy configuration to monitor this kind of situations.
In this tutorial we configure a monitoring for our example tenant demo. To configure the monitoring for your search you must replace the tenant demo by your own tenant.
At first you have to crate a new monitoring:
- Go to https://qsc-dev.quasiris.de/console/monitoring/playground
- Create a new monitoring my-first-monitoring
- check the monitoring by the API https://qsc.quasiris.de/api/v1/monitoring/check/playground/my-first-monitoring
- get details https://qsc.quasiris.de/api/v1/monitoring/details/playground/my-first-monitoring
- replace your tenant by
playgroundand your code bymy-first-monitoring
At the moment this feature is just available for experienced users, with access to the Raw tab.
Concept
- the monitoring is processed in two parts
Retrieval: first retrieve the dataValidation: second validate the data
Retrieval
- retrieve data by a http API
- the API can be internal or external
Retrieval
- validate the data
- extract by json path
- create conditions that evaluate the data
- a condition must return true or false
- configure a severity
- if the condition is false the configured severity is returned
- if the condition is true OK is returned
Retrieval http
GET Example
{
  "retrieval": {
    "retrievalType": "http",
    "http": {
      "request": {
        "url": "https://qsc.quasiris.de/api/v1/search/demo/trendware?q=*",
        "method": "GET",
        "headers": []
      }
    }
  }
}
POST Example
{
  "retrieval": {
    "retrievalType": "http",
    "http": {
      "request": {
        "url": "https://qsc.quasiris.de/api/v1/search/demo/trendware",
        "method": "POST",
        "headers": [],
        "body": {
          "q": "*"
        }
      }
    }
  }
}
Retrieval internalHttp
{
  "retrieval": {
    "retrievalType": "internalHttp",
    "internalHttp": {
      "request": {
        "requestPath": "/api/v1/admin/feeding/history/search/ab/products",
        "method": "POST",
        "body": {
          "page": 1,
          "q": "*",
          "requestId": "",
          "rows": 20,
          "searchFilters": []
        }
      }
    }
  }
}
Validation jsonPathJexlRule
ruleType:jsonPathJexlRulethe type of the validationdata- extract data that can be used for validation by jsonPathcondition- jexl condition - it is possible to use the extracted variables in the conditions
{
 "validation": {
  "rules": [
   {
    "ruleType": "jsonPathJexlRule",
    "jsonPathJexlRule": {
     "data": {
      "type": "$.result.queue.documents[0].document.type",
      "createdAt": "$.result.queue.documents[0].document.createdAt"
     },
     "condition": "type == 'qsc'"
    },
    "severity": "warn",
    "comment": "a very nice rule"
   },
   {
    "ruleType": "jsonPathJexlRule",
    "jsonPathJexlRule": {
     "data": {
      "type": "$.result.queue.documents[0].document.type",
      "createdAt": "$.result.queue.documents[0].document.createdAt"
     },
     "condition": "DateChecker.isRecent(createdAt, 'PT480H')"
    },
    "severity": "warn"
   },
   {
    "ruleType": "jsonPathJexlRule",
    "jsonPathJexlRule": {
     "data": {
      "type": "$.result.queue.documents[0].document.type",
      "createdAt": "$.result.queue.documents[0].document.createdAt"
     },
     "condition": "DateChecker.isRecent(createdAt, Duration.ofDays(1))"
    },
    "severity": "error"
   }
  ]
 }
}
JsonPath Examples
- total: extract the total hits
- time: extract the response time
- timestamp: extract the field timestamp from the first document
- yesterday: extract the facet with the
id=timestampand retrieve thecountof thevalue=Gestern
{
  "data": {
    "total": "$.result.reporting.total",
    "time": "$.result.reporting.time",
    "timestamp": "$.result.reporting.documents[0].document.timestamp",
    "yesterday": "$.result.reporting.facets[?(@.id=='timestamp')].values[?(@.value=='Gestern')].count"
  }
}
Jexl Condition Expamples
type == 'qsc'
Datechecker
- check for the last day
- java Duration API
DateChecker.isRecent(createdAt, Duration.ofDays(1)) - ISO duration
DateChecker.isRecent(createdAt, 'PT480H') - https://qsc.quasiris.de/s/iso-8601-durations
- java Duration API
Alerting
For alerting you can connect you favorite monitoring tool to the monitoring endpoint.
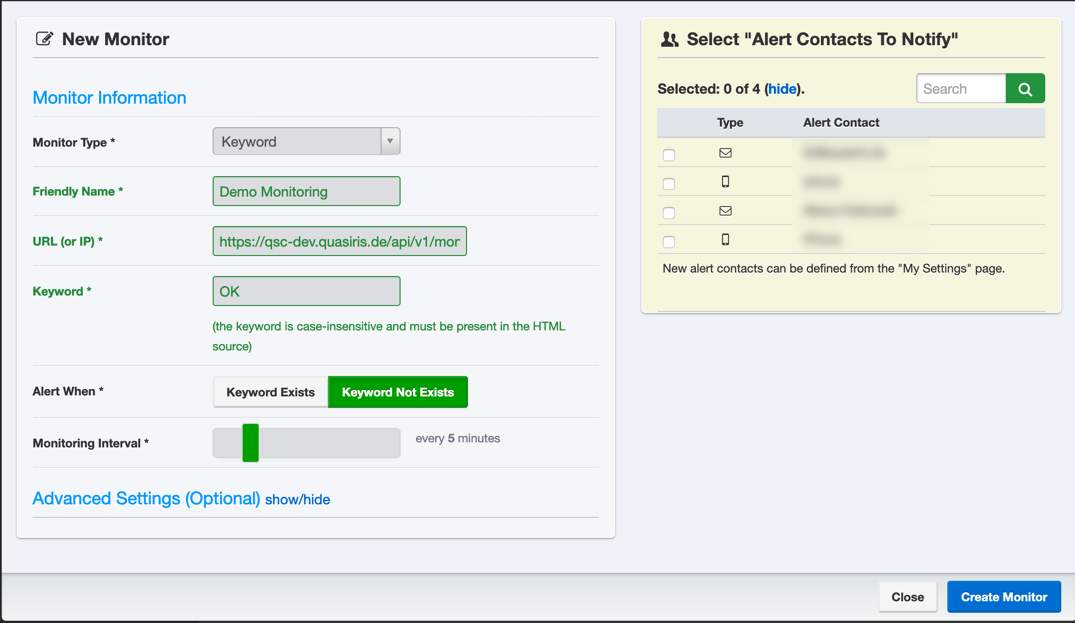
- https://qsc-dev.quasiris.de/api/v1/monitoring/check/demo/my-first-monitoring and check that the keyword OK exists.
In case of a warning the check returons WARN. In case of an error the check returons ERROR.
Uptime Robot
A favorite Tool for monitoring is uptime robot.
- go to https://uptimerobot.com/
- sign up
- add new monitoring
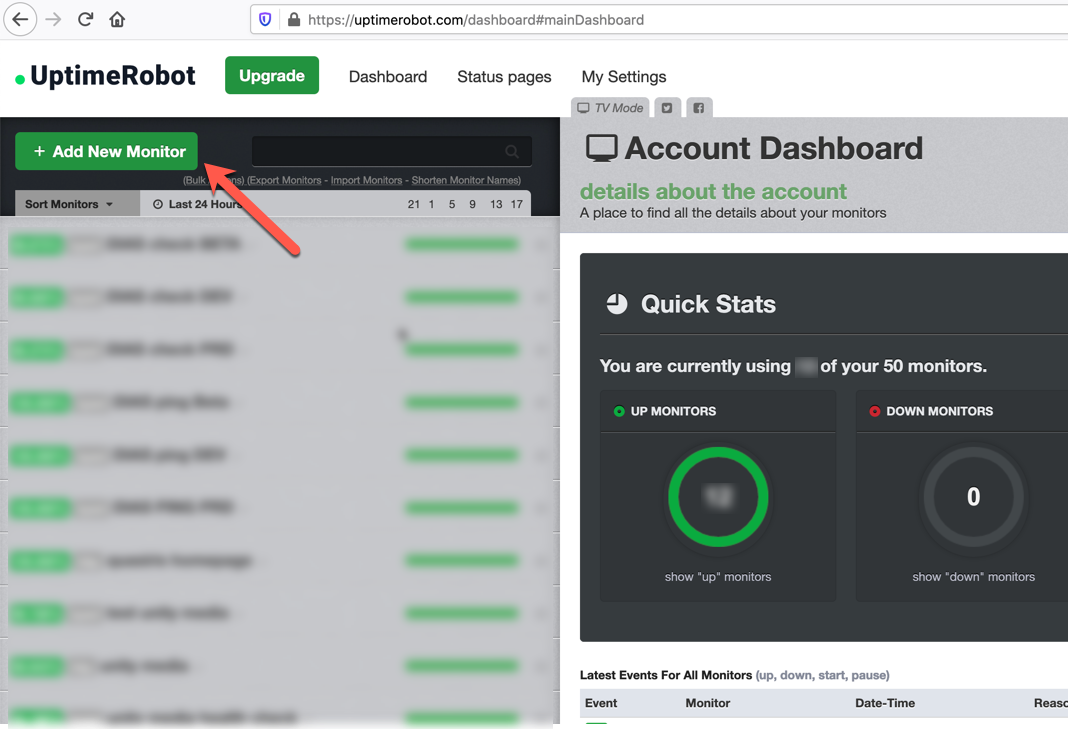
- get notified in case of a problem
Other Monitoring tools
- Nagios
- Ganglia
- CollectD
- Cacti
- Icinga
- checkmk
- Prometheus + Grafana
- New Relic
Security
The monitoring endpoint can be secured by an API Key or a Basic Auth.